
QUANTIFIED SELF
This curiosity about sleep inspired my data collection for my project in information architecture. I decided to record and track my sleep.
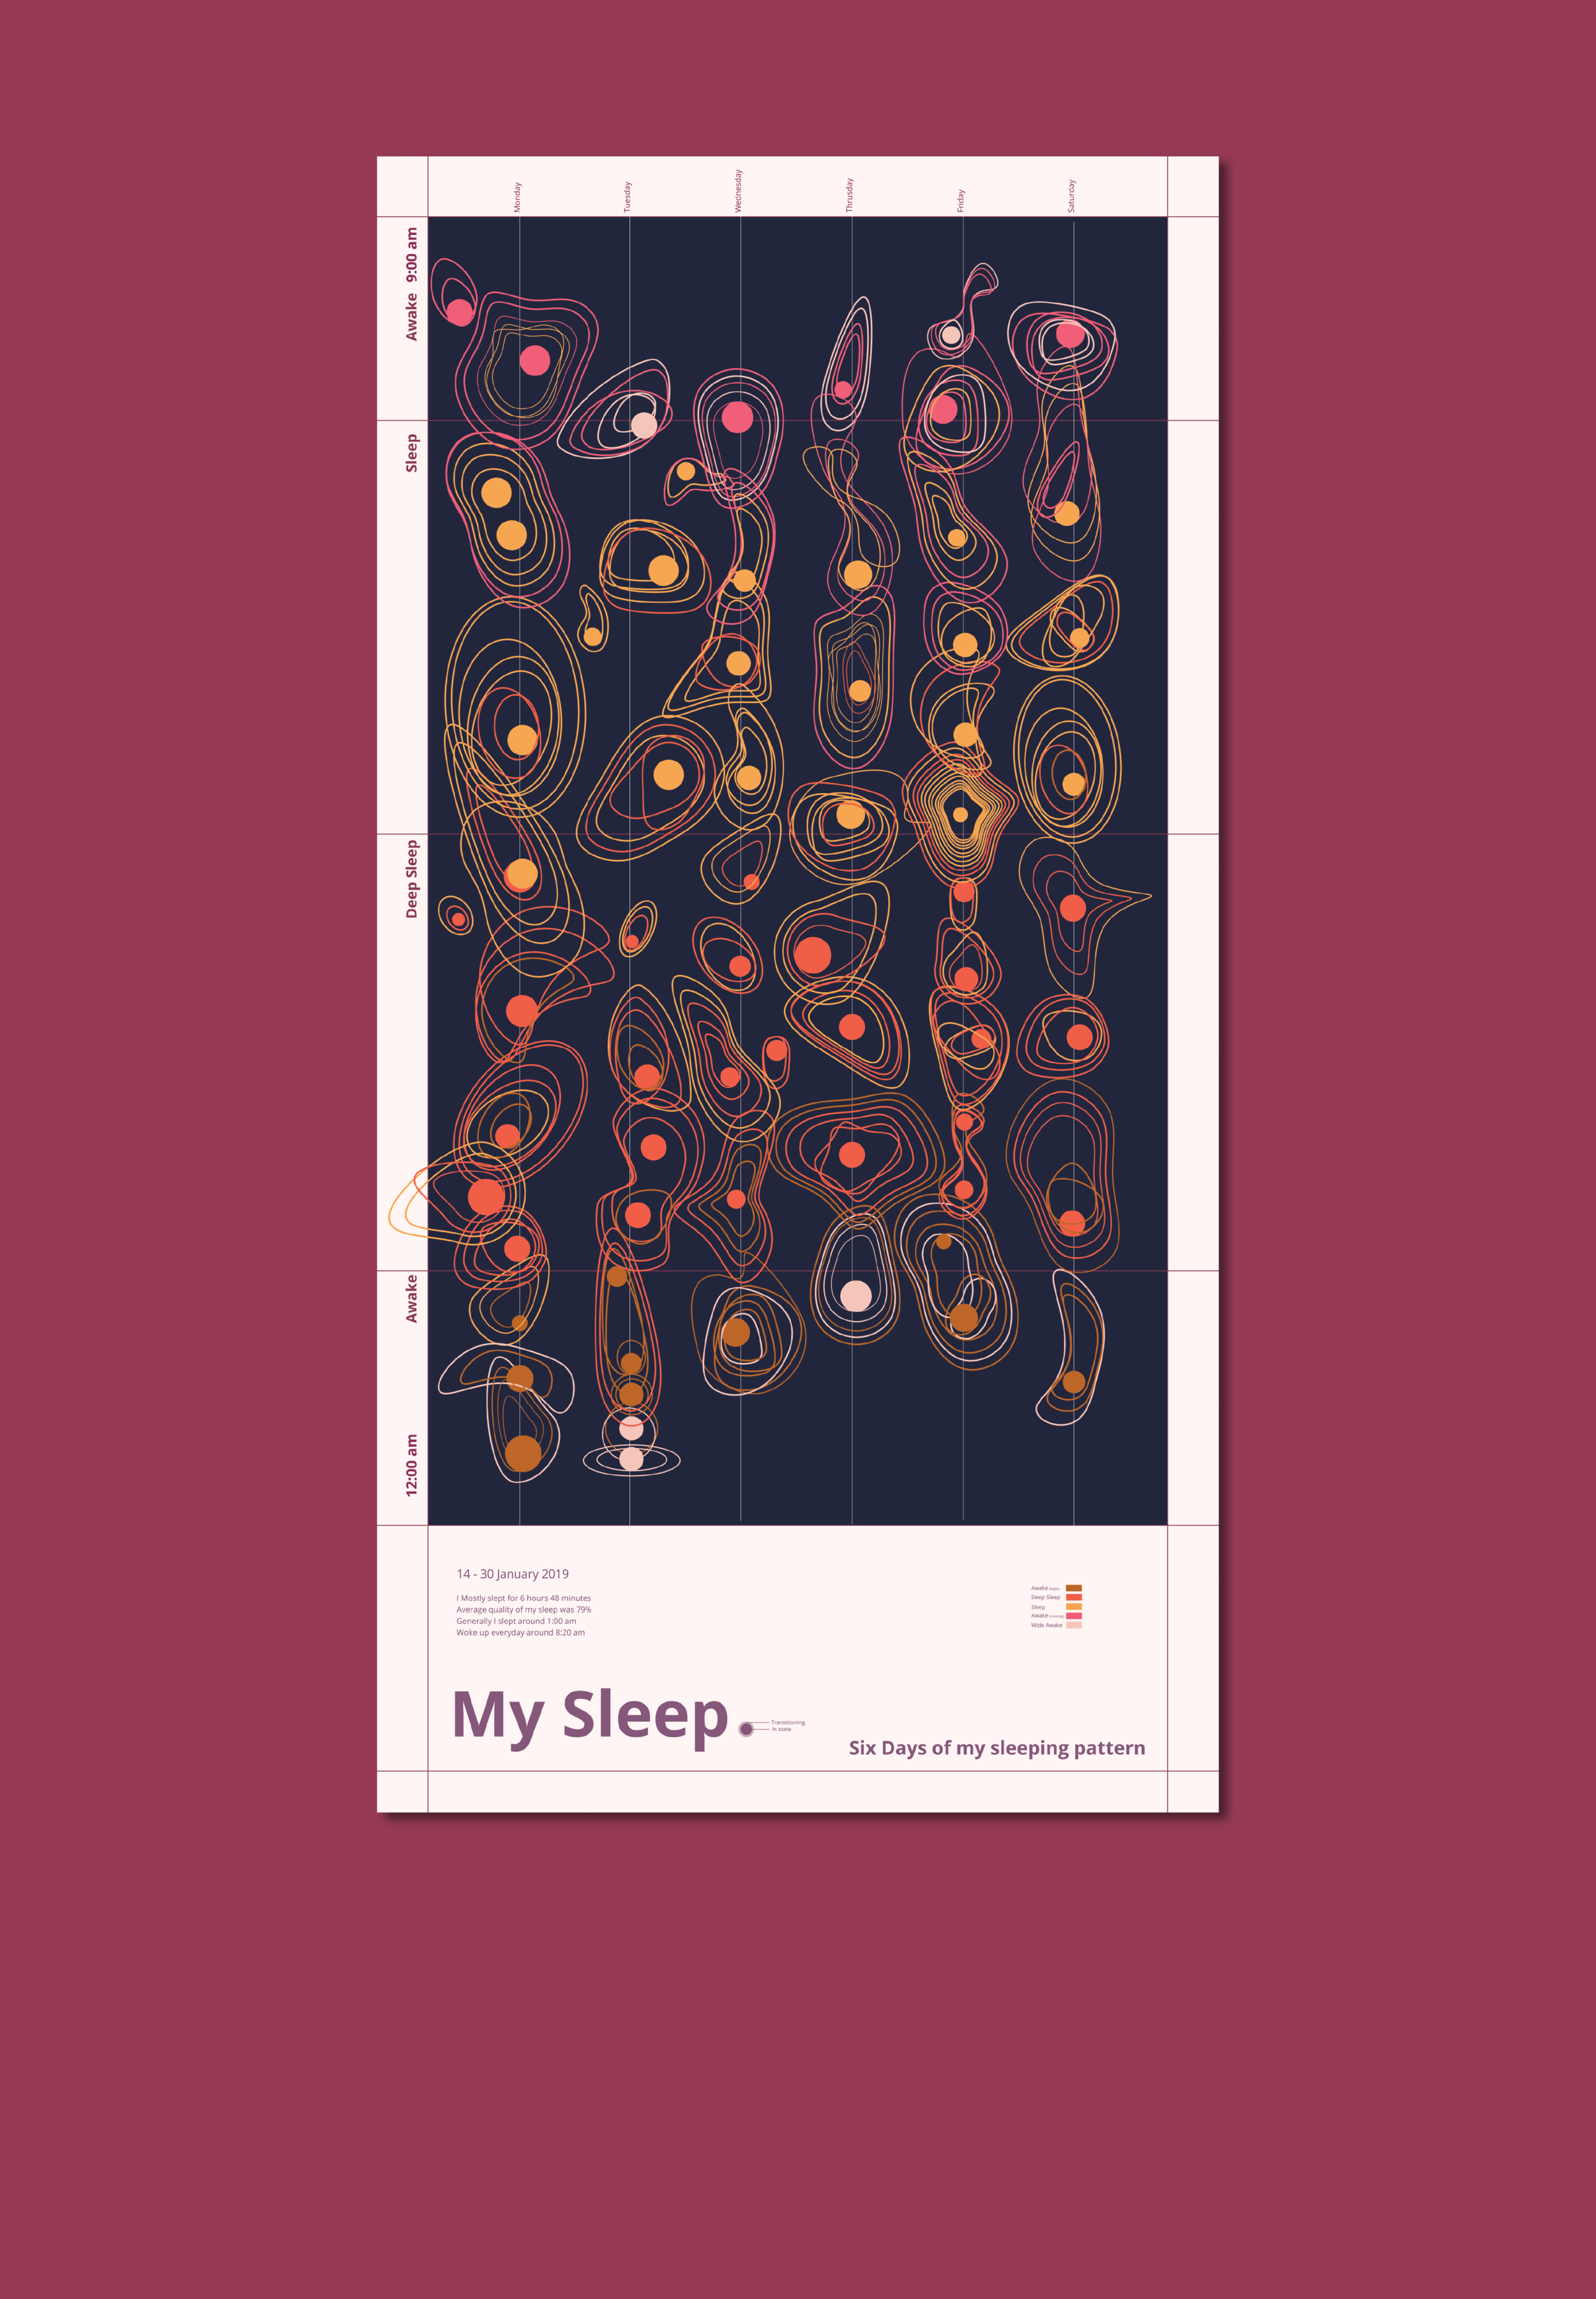
Data Collection
I collected data for one week consisting of plethora of data sets. The data points collected included the time I went to bed, the time I woke up, duration of my sleep every night, the quality of my sleep every night and the transitions between different cycles of sleep.
I collected data using a sleep tracking app called sleep cycle. I used google sheets to keep track of my daily record. This way I was able to make my calculations quicker and more accurate.

Idea Visualisation
These are a few initial sketches of how I wanted to represent the data I had collected. I wanted to focus on the transitions from one stage to another and how that was related to the number of dips in the night.

Inspiration
In trying to find a simple way to articulate multiple data sets, I began looking at vibrations and meditational sounds to understand how seamless and impactful complex radiations transitions are.

Iterating
The initial visualisation were rigid, so I tried to go towards more fluid wave like forms to resonate with vibrations. I feel these organic forms are symbolic to something what one experiences every night.

Takeaways
I understood the importance of strategy while processing large amount of data. I relied heavily on colour coding to sort the information. Quantifying my sleep data made me realise the detailed stages and transitions that one goes through while sleeping. This fairly slow human processing power is what made me realise the potential for machine learning.